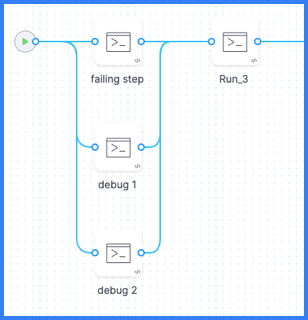
Use a parallel step to monitor failures
If you need to debug failures that aren't captured in the standard Build logs, you can add two Run steps to your pipeline that run in parallel with the failing step. The Run steps contain commands that monitor the activity of the failing step and generate logs that can help you debug the failing step.
In your pipeline's YAML, add the two debug monitoring steps, as shown in the following example, alongside the failing step, and group the three steps in parallel. Make sure the timeout is long enough to cover the time it takes for the failing step to fail; otherwise the debug steps will timeout before capturing the full logs for the failing step.
              - parallel:
                  - step:
                      type: Run
                      name: failing step
                      ...
                  - step:
                      type: Run
                      name: Debug monitor 1
                      identifier: debug_monitor_1
                      spec:
                        connectorRef: YOUR_DOCKER_CONNECTOR ## Specify your Docker connector's ID.
                        image: alpine ## Specify an image relevant to your build.
                        shell: Sh
                        command: top -d 10
                      timeout: 10m ## Allow enough time to cover the failing step.
                  - step:
                      type: Run
                      name: Debug monitor 2
                      identifier: debug_monitor_2
                      spec:
                        connectorRef: YOUR_DOCKER_CONNECTOR ## Specify your Docker connector's ID.
                        image: alpine ## Specify an image relevant to your build.
                        shell: Sh
                        command: |-
                          i=0
                          while [ $i -lt 10 ]
                          do
                              df -h
                              du -sh *
                              sleep 10
                              i=`expr $i + 1`
                          done
                      timeout: 10m ## Allow enough time to cover the failing step.
                  - step:
                      type: Run
                      name: Backgroung Monitor ## This step lists what background tasks are running which impacts step completion.
                      identifier: debug_monitor_3
                      spec:
                        connectorRef: YOUR_DOCKER_CONNECTOR
                        image: alpine
                        shell: Sh
                        command: |-
                          i=0
                          while [ $i -lt 10 ]
                          do
                              ps -ef ##
                              sleep 10
                              i=`expr $i + 1`
                          done
                      timeout: 10m
              - step: ## Other steps are outside the parallel group.
                  type: Run
                  name: Run 3
                  ...
After adding the debug monitoring steps, run your pipeline, and then check the debug steps' Build logs.
Your parallel group (under the -parallel flag) should include only the two debug monitoring steps and the failing step.
You can arrange steps in parallel in the Visual editor by dragging and dropping steps to rearrange them.
